Diagramkälla:
http://www.sciencedirect.com/science/article/pii/S0277379108001479
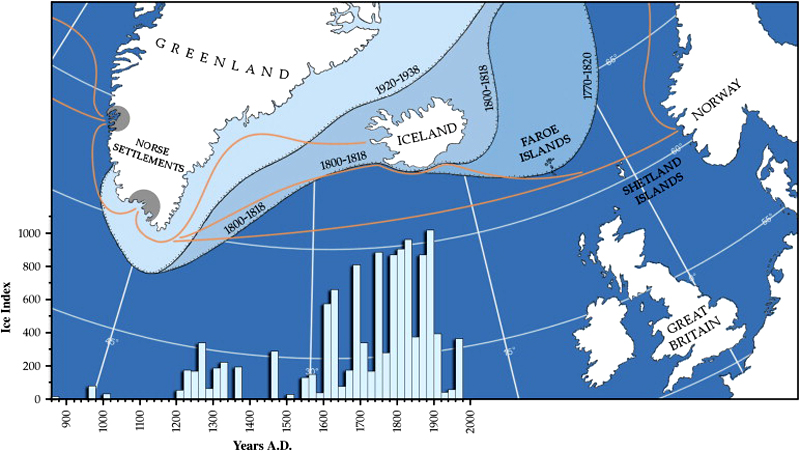
Efter värmeperioden under stenåldern började gläciärer speciellt på
norra halvklotet att återbildas och dessa nådde ofta sitt maximum umder
den lilla istiden. Det var också extra mycket is i norra Atlanten under
denna tid vilket vi kan se av kartan. Den visar vårisens utbredning unde
tre perioder. Ljusbruna linjer visar de normala seglingsvägarna från
Norge och västerut. Stapel diagrammen visar både mängd drivis och tiden
för denna vid Islands kust. Man måste säga att det blivit bättre på
senare tid.
Läs vidare på
bloggen
![]() After the Holocene varm maximum in the Stone Age
glaciers began, especially in the northern hemisphere, to form and these
often reached its maximum during the Little Ice Age. There was also more
ice than normal in the North Atlantic during this time as we can see
from the map. It shows extent of spring ice during three periods. Light
brown lines show the normal sailing routes from Norway to the west. The
bar charts show both the amount of ice and the time for this at the
Islands coasts. You have to say that it has improved a lot in recent
times
After the Holocene varm maximum in the Stone Age
glaciers began, especially in the northern hemisphere, to form and these
often reached its maximum during the Little Ice Age. There was also more
ice than normal in the North Atlantic during this time as we can see
from the map. It shows extent of spring ice during three periods. Light
brown lines show the normal sailing routes from Norway to the west. The
bar charts show both the amount of ice and the time for this at the
Islands coasts. You have to say that it has improved a lot in recent
times
Please read theblog